Pareto Chart Analysis is one of the seven statistical quality control tool. It helps project team or the decision maker to identify key contributing issues and to take corrective measures on time, ensuring continuous improvement in the desired outcome in order to maximize the output for the system.
The concept was founded by management Guru Joseph M Juran and named it after Italian economist Mr. Vilfredo Pareto, who at first observed that 80% of the income of Italy is from 20% of the population.
The concept can well be applied to many aspects, few listed below: -20% of the products and services accounted for 80% of the company’s profit. -20% of the sales forces accounted for the 80% of the revenue. -20% of the system defects caused 80% of the problems. In this blog, we will see how “Pareto Chart Analysis” can help us in our projects or day to day activities to identify the causes which are contributing to most of the issues.
Sample Situation where this helps !!!
Imagine that you’ve just stepped into a new role as head of department. Unsurprisingly, you’ve inherited a whole host of problems that need your attention. Ideally, you would like to focus on resolving the most vital problems. But how do you decide which problems you need to deal with first? And are some problems caused by the same underlying issue? This is where you can go ahead with Pareto Chart Analysis.
What is a Pareto Chart?
A Pareto Chart is a type of Bar Chart in which a series of bars which signifies contributing factors are arranged based on the magnitude of the effect. This relatively means that the tall bars on the left are more significant than on the right. Also known as 80/20 rule, where it states that roughly 80% of the effects come from 20% of the causes.
When should we use a Pareto Chart?
When you want to break big problems into smaller causes and identify major contributors
When you want to focus and prioritize your efforts
When there are multiple problems or reasons and you want to focus on most significant ones
When Analyzing the frequency of causes or reasons
When Data can be categorized and you can determine the number of incidents in each category.
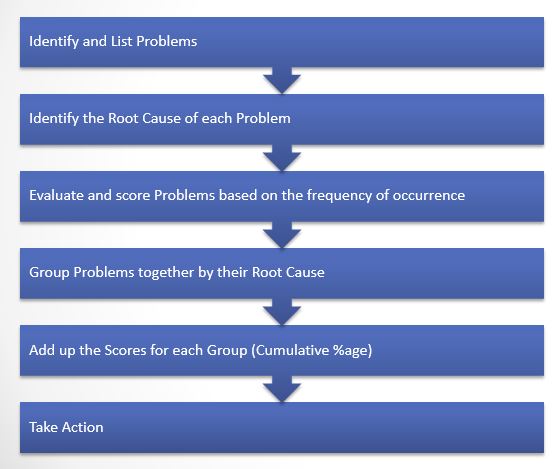
How to Use the Pareto Chart Tool ?
Web service will be hosted in a centralized location, which will be connected to the database server to serve client request. Service does not have any idea about which client is going to call, that means it is independent of client. Above image depict different types of client calling single service. Web services based on REST Architecture are known as RESTful web services. The following principles encourage RESTful services to be simple, lightweight and fast.
1. Stateless interaction
Every interaction with a resource is stateless. That means request messages are self-contained. Stateful interactions are based on explicit state transfer. By stateless it means that the server does not store any state about the client session on the server side. The session is stored on the client side. The server is stateless means that every server can service any client at any time, there is no session affinity. The relevant session information is stored on the client and passed to server as needed. That is where the State Transfer in REST comes from.
2. Resource identification through URL
A RESTful web service exposes a set of resources that identify targets of the interaction with its clients. Resources are identified by URLs, which provide a global addressing space for resource and service discovery.
3. Uniform Interface
Resources are manipulated using a fixed set CRUD (Create, Read, Update and Delete) operations. This is achieved using sets of HTTP methods. Followings are well known HTTP methods are commonly used in REST based architecture.
How do we interpret a Pareto Chart?
When you look at a Pareto Chart, you can see break points in the heights of the bars which indicates the most important categories. This information is useful when you are establishing priorities.
Sample Analysis:
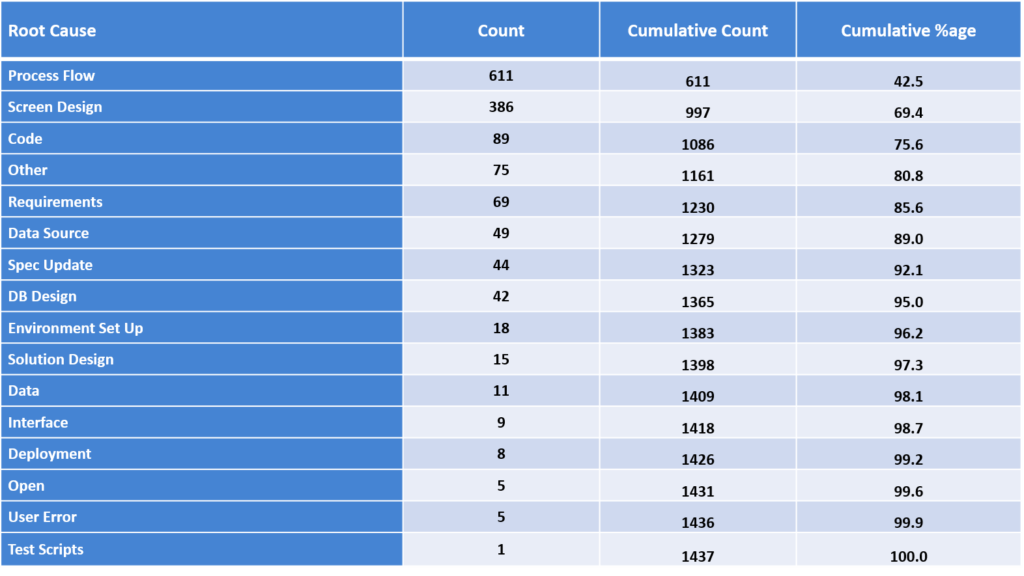
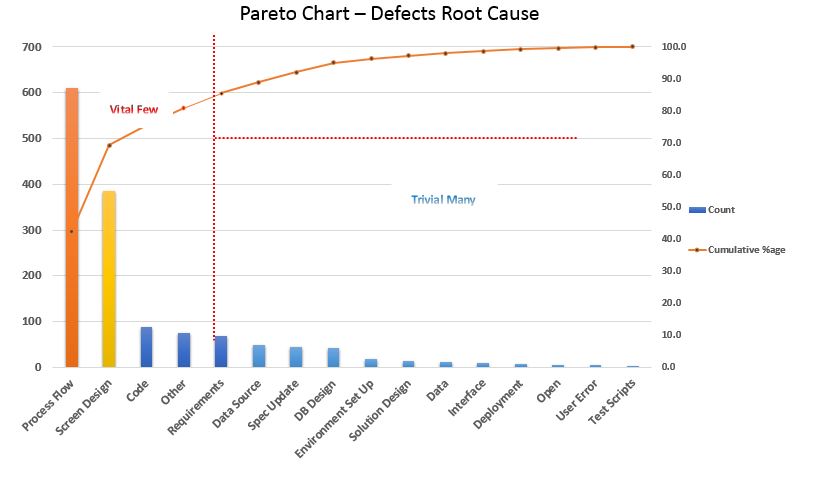
Below data highlighted is an example to demonstrate the Pareto Chart Tool. ABC Holdings is looking forward to write down their existing application and Target is to build a new generation robust and scalable application interacting with multiple systems . Required interested parties have been identified for the solution and a project team has been set up for the implementation. Timelines set were very challenging. Business Analysts team created the initial wire-frames and high level technical process flows based on inputs from Business Users, provided them as inputs to Development team. Development team started building the new application with inputs as wire-frames , step wise Process Flows and by comparing functionalities within existing application. Minimal Unit Testing was performed due to delay in timelines as development took more time than anticipated. Release was then delivered to QA team for testing. Testing team created an extensive set of test scripts to verify and validate the application from Business Perspective. Identified 1400+ defects in system testing phase which were categorized under various root causes as listed below. HOD for Information Technology was appointed at the end of the first phase of project to bring down the flaws in the process and take corrective actions to bridge those gaps. He asked team to carry out the Pareto Analysis for the defects to identify and focus on vital issues. He got the contributing factors from the Pareto Analysis performed as mentioned in below diagrams and recommendations as well.
Advantages
1. Simplicity: REST services can be accessed from any browser.
2. Lighter on Bandwidth: Less data is transferred over network with serialized json/xml data format.
3. Security: REST application security rules can be setup using the http standards. The administrator (or firewall) can discern the intent of each message by analyzing the HTTP command used in the request. For example, a GET request can always be considered safe because it can’t, by definition, modify any data.